
 RSS
RSSTruncated normal distribution
Where will you meet this distribution?
- Econometrics : probit model, tobit model
- Marketing
“Use of the Left-Truncated Normal Distribution for Improving Achieved Service Levels” by Arvid C. Johnson
- Agriculte
Shape of Distribution
Basic Properties
- Four parameters
are required (How can you get these).
- Continuous distribution defined on bounded range
- This distribution can be symmetric or asymmetric.


Probability
- Cumulative distribution function
where
and
is cumulative distribution function of standard normal distribution.
- Probability density function
- How to compute these on Excel.
1 2
3 4 5 6 7 8
9
A B Data Description 2.5 Value for which you want the distribution 1 Value of parameter Min 4 Value of parameter Max 3 Value of parameter M 0.9 Value of parameter Sigma Formula Description (Result) =NTTRUNCNORMDIST(A2,A3,A4,A5,A6,TRUE) Cumulative distribution function for the terms above =NTTRUNCNORMDIST(A2,A3,A4,A5,A6,FALSE) Probability density function for the terms above 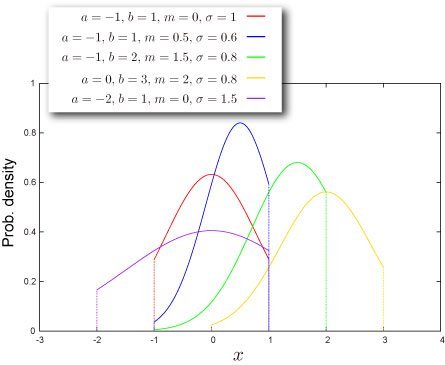
- Function reference : NTTRUNCNORMDIST
![F(x)=\frac{1}{\Delta}\left[\Phi\left(\frac{x-m}{\sigma}\right)-\Phi(A)\right]](http://s0.wp.com/latex.php?latex=F%28x%29%3D%5Cfrac%7B1%7D%7B%5CDelta%7D%5Cleft%5B%5CPhi%5Cleft%28%5Cfrac%7Bx-m%7D%7B%5Csigma%7D%5Cright%29-%5CPhi%28A%29%5Cright%5D&bg=T&fg=000000&s=0 "F(x)=\frac{1}{\Delta}\left[\Phi\left(\frac{x-m}{\sigma}\right)-\Phi(A)\right]")
-\Phi(A)")

=\frac{1}{\sigma\Delta}\phi\left(\frac{x-m}{\sigma}\right)")
Quantile
- Inverse of cumulative distribution function
where
and
- How to compute this on Excel.
1 2
3 4 5 6 7 8
A B Data Description 0.5 Probability associated with the truncated normal distribution 1 Value of parameter Min 4 Value of parameter Max 3 Value of parameter M 0.9 Value of parameter Sigma Formula Description (Result) =NTTRUNCNORMINV(A2,A3,A4,A5,A6) Inverse of the cumulative distribution function for the terms above - Function reference : NTTRUNCNORMINV
![F^{-1}(P)=\sigma\Phi^{-1}\left[\Delta P+\Phi(A)\right]+m](http://s0.wp.com/latex.php?latex=F%5E%7B-1%7D%28P%29%3D%5Csigma%5CPhi%5E%7B-1%7D%5Cleft%5B%5CDelta+P%2B%5CPhi%28A%29%5Cright%5D%2Bm&bg=T&fg=000000&s=0 "F^{-1}(P)=\sigma\Phi^{-1}\left[\Delta P+\Phi(A)\right]+m")

Characteristics
Mean – Where is the “center” of the distribution? (Definition)
- Mean of the distribution is given as
where
,
are probability density function and cumulative distribution function of standard normal distribution respectively.
- How to compute this on Excel
1 2 3 4 5 6 7 A B Data Description 1 Value of parameter Min 4 Value of parameter Max 3 Value of parameter M 0.9 Value of parameter Sigma Formula Description (Result) =NTTRUNCNORMMEAN(A2,A3,A4,A5) Mean of the distribution for the terms above - Function reference : NTTRUNCNORMMEAN
-\phi(B)}{\Delta}\sigma")
Standard Deviation – How wide does the distribution spread? (Definition)
- Variance of the distribution is given as
where
,
Standard Deviation is a positive square root of Variance.
- How to compute this on Excel
1 2 3 4 5 6 7
A B Data Description 1 Value of parameter Min 4 Value of parameter Max 3 Value of parameter M 0.9 Value of parameter Sigma Formula Description (Result) =NTTRUNCNORMSTDEV(A2,A3,A4,A5) Standard deviation of the distribution for the terms above - Function reference : NTTRUNCNORMSTDEV
![\left[1+\frac{A\phi(A)-B\phi(B)}{\Delta}-\left(\frac{\phi(A)-\phi(B)}{\Delta}\right)^2\right]\sigma^2](http://s0.wp.com/latex.php?latex=%5Cleft%5B1%2B%5Cfrac%7BA%5Cphi%28A%29-B%5Cphi%28B%29%7D%7B%5CDelta%7D-%5Cleft%28%5Cfrac%7B%5Cphi%28A%29-%5Cphi%28B%29%7D%7B%5CDelta%7D%5Cright%29%5E2%5Cright%5D%5Csigma%5E2&bg=T&fg=000000&s=0 "\left[1+\frac{A\phi(A)-B\phi(B)}{\Delta}-\left(\frac{\phi(A)-\phi(B)}{\Delta}\right)^2\right]\sigma^2")
Skewness – Which side is the distribution distorted into? (Definition)
- Skewness of the distribution is given as
where
,
- How to compute this on Excel
1 2 3 4 5 6 7
A B Data Description 1 Value of parameter Min 4 Value of parameter Max 3 Value of parameter M 0.9 Value of parameter Sigma Formula Description (Result) =NTTRUNCNORMSKEW(A2,A3,A4,A5) Skewness of the distribution for the terms above - Function reference : NTTRUNCNORMSKEW
![-\frac{1}{V^{3/2}}\left[2\Delta_0+(3\Delta_{1}-1)\Delta_0+\Delta_2\right]](http://s0.wp.com/latex.php?latex=-%5Cfrac%7B1%7D%7BV%5E%7B3%2F2%7D%7D%5Cleft%5B2%5CDelta_0%2B%283%5CDelta_%7B1%7D-1%29%5CDelta_0%2B%5CDelta_2%5Cright%5D&bg=T&fg=000000&s=0 "-\frac{1}{V^{3/2}}\left[2\Delta_0+(3\Delta_{1}-1)\Delta_0+\Delta_2\right]")
=\frac{\phi(x)}{\Delta}")
-A^kz(A)")

Kurtosis – Sharp or Dull, consequently Fat Tail or Thin Tail (Definition)
- Kurtosis of the distribution is given as
where
,
- How to compute this on Excel
1 2 3 4 5 6 7 A B Data Description 1 Value of parameter Min 4 Value of parameter Max 3 Value of parameter M 0.9 Value of parameter Sigma Formula Description (Result) =NTLOGNORMKURT(A2,A3,A4,A5) Kurtosis of the distribution for the terms above - Function reference : NTTRUNCNORMKURT
![\frac{1}{V^2}\left[-3\Delta_0^4-2\Delta_0^2(3\Delta_1+1)-4\Delta_2\Delta_0-3\Delta_1-\Delta_3+3\right]-3](http://s0.wp.com/latex.php?latex=%5Cfrac%7B1%7D%7BV%5E2%7D%5Cleft%5B-3%5CDelta_0%5E4-2%5CDelta_0%5E2%283%5CDelta_1%2B1%29-4%5CDelta_2%5CDelta_0-3%5CDelta_1-%5CDelta_3%2B3%5Cright%5D-3&bg=T&fg=000000&s=0 "\frac{1}{V^2}\left[-3\Delta_0^4-2\Delta_0^2(3\Delta_1+1)-4\Delta_2\Delta_0-3\Delta_1-\Delta_3+3\right]-3")
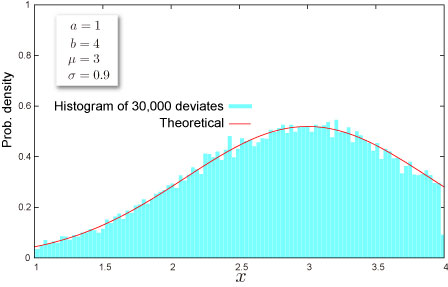
Random Numbers
- Random number x is generated by inverse function method, which is for uniform random U,
where
,
- How to generate random numbers on Excel.
1 2 3 4 5 6 7 A B Data Description 1 lower limit of support 4 upper limit of support 3 Value of parameter M 0.9 Value of parameter Sigma Formula Description (Result) =NTRANDTRUNCNORM(100,A2,A3,A4,A5,0) 100 truncated normal deviates based on Mersenne-Twister algorithm for which the parameters above Note The formula in the example must be entered as an array formula. After copying the example to a blank worksheet, select the range A7:A106 starting with the formula cell. Press F2, and then press CTRL+SHIFT+ENTER.
![x=\sigma\Phi^{-1}\left[\Delta U+\Phi(A)\right]+m](http://s0.wp.com/latex.php?latex=x%3D%5Csigma%5CPhi%5E%7B-1%7D%5Cleft%5B%5CDelta+U%2B%5CPhi%28A%29%5Cright%5D%2Bm&bg=T&fg=000000&s=0 "x=\sigma\Phi^{-1}\left[\Delta U+\Phi(A)\right]+m")
NtRand Functions
- If you already have parameters of the distribution
- Generating random numbers based on Mersenne Twister algorithm: NTRANDTRUNCNORM
- Computing probability : NTTRUNCNORMDIST
- Computing quantile : NTTRUNCNORMINV
- Computing mean : NTTRUNCNORMMEAN
- Computing standard deviation : NTTRUNCNORMSTDEV
- Computing skewness : NTTRUNCNORMSKEW
- Computing kurtosis : NTTRUNCNORMKURT
- Computing moments above at once : NTTRUNCNORMMOM
- If you know mean and standard deviation of the distribution
- Estimating parameters of the distribution:NTTRUNCNORMPARAM