
 RSS
RSSTriangular distribution
Where do you meet this distribution?
- Project management – PERT, CPM and so on
- Digital signal processing (dithering) – digital audio, digital video, digital photography, seismology, RADAR, weather forecasting systems and many more
- Data security
- Business simulation (Corporate finance)
- Proxy of Beta distribution
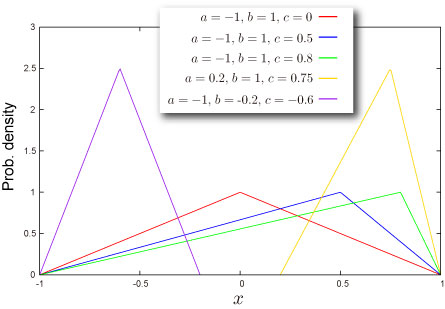
Shape of Distribution
Basic Properties
- Three parameters
are required (How can you get these).
These parameters are minimum value of variable, maximum value of variable and mode of the distribution respectively.
- Continuous distribution defined on bounded range
- This distribution can be symmetric or asymmetric.


Probability
- Cumulative distribution function
- Probability density function
- How to compute these on Excel.
1 2 3 4 5 6 7
8
A B Data Description 1.5 Value for which you want the distribution 1 Value of parameter Min 3 Value of parameter Max 1.4 Value of parameter Mode Formula Description (Result) =NTTRIANGULARDIST(A2,A3,A4,A5,TRUE) Cumulative distribution function for the terms above =NTTRIANGULARDIST(A2,A3,A4,A5,FALSE) Probability density function for the terms above - Function reference : NTTRIANGULARDIST
=\begin{cases}\frac{(x-a)^2}{(b-a)(c-a)}\quad&(a\leq x<c)\\1-\frac{(b-x)^2}{(b-a)(b-c)}\quad&(c\leq x\leq b)\end{cases}")
=\begin{cases}\frac{2(x-a)}{(b-a)(c-a)}\quad&(a\leq x<c)\\\frac{2(b-x)}{(b-a)(b-c)}\quad&(c\leq x\leq b)\end{cases}")
Quantile
- Inverse function of cumulative distribution function
- How to compute this on Excel
1 2 3 4 5 6 A B Data Description 1 Value of parameter Min 3 Value of parameter Max 1.4 Value of parameter Mode Formula Description (Result) =NTTRIANGULARMEAN(A2,A3,A4) Mean of the distribution for the terms above - Function reference : NTTRIANGULARMEAN
![F^{-1}(P)=\begin{cases}\sqrt{P(c-a)(b-a)}+a\quad&\left(P< \frac{c-a}{b-a}\right)\\-\sqrt{(1-P)(b-c)(b-a)}+b\quad&\left(P\geq \frac{c-a}{b-a}\right)\end{cases}[/latex]</div> </li> <li>How to compute this on Excel. <table class="table_example"> <tbody> <tr> <td class="table_number"> <table> <tbody> <tr> <th class="underthick"> </th> </tr> <tr> <th>1</th> </tr> <tr> <th>2</th> </tr> <tr> <th>3</th> </tr> <tr> <th>4</th> </tr> <tr> <th>5</th> </tr> <tr> <th>6</th> </tr> <tr> <th>7 </th> </tr> </tbody> </table> </td> <td> <table> <tbody> <tr> <th class="underthick">A</th> <th class="underthick">B</th> </tr> <tr> <th class="elements">Data</th> <th class="elements">Description</th> </tr> <tr> <td>0.5</td> <td>Probability associated with the distribution</td> </tr> <tr> <td>1</td> <td>Value of parameter Min</td> </tr> <tr> <td>3</td> <td>Value of parameter Max</td> </tr> <tr> <td>1.4</td> <td>Value of parameter Mode</td> </tr> <tr> <th class="elements">Formula</th> <th class="elements">Description (Result)</th> </tr> <tr> <td>=NTTRIANGULARINV(A2,A3,A4,A5)</td> <td>Inverse of the cumulative distribution function for the terms above</td> </tr> </tbody> </table> </td> </tr> </tbody> </table> </li> <li>Function reference : <a href="/nttriangularinv/">NTTRIANGULARINV</a></li> </ul> </div> <h2>Characteristics</h2> <h3>Mean<span class="sub"> - Where is the ``center'' of the distribution? (<a href="/glossary/#local_mean">Definition</a>)</span></h3> <div class="detail"> <ul class="dot"> <li><a href="/glossary/#local_mean">Mean</a> of the distribution is given as <div class="eq">[latex]\frac{a+b+c}{3}](http://s0.wp.com/latex.php?latex=F%5E%7B-1%7D%28P%29%3D%5Cbegin%7Bcases%7D%5Csqrt%7BP%28c-a%29%28b-a%29%7D%2Ba%5Cquad%26%5Cleft%28P%3C+%5Cfrac%7Bc-a%7D%7Bb-a%7D%5Cright%29%5C%5C-%5Csqrt%7B%281-P%29%28b-c%29%28b-a%29%7D%2Bb%5Cquad%26%5Cleft%28P%5Cgeq+%5Cfrac%7Bc-a%7D%7Bb-a%7D%5Cright%29%5Cend%7Bcases%7D%26%2391%3B%2Flatex%26%2393%3B%3C%2Fdiv%3E+%3C%2Fli%3E+%3Cli%3EHow+to+compute+this+on+Excel.++%3Ctable+class%3D%22table_example%22%3E+%3Ctbody%3E+%3Ctr%3E+%3Ctd+class%3D%22table_number%22%3E+%3Ctable%3E+%3Ctbody%3E+%3Ctr%3E+%3Cth+class%3D%22underthick%22%3E%26nbsp%3B%3C%2Fth%3E+%3C%2Ftr%3E+%3Ctr%3E+%3Cth%3E1%3C%2Fth%3E+%3C%2Ftr%3E+%3Ctr%3E+%3Cth%3E2%3C%2Fth%3E+%3C%2Ftr%3E+%3Ctr%3E+%3Cth%3E3%3C%2Fth%3E+%3C%2Ftr%3E+%3Ctr%3E+%3Cth%3E4%3C%2Fth%3E+%3C%2Ftr%3E+%3Ctr%3E+%3Cth%3E5%3C%2Fth%3E+%3C%2Ftr%3E+%3Ctr%3E+%3Cth%3E6%3C%2Fth%3E+%3C%2Ftr%3E+%3Ctr%3E+%3Cth%3E7+%26nbsp%3B%26nbsp%3B%26nbsp%3B%3C%2Fth%3E+%3C%2Ftr%3E+%3C%2Ftbody%3E+%3C%2Ftable%3E+%3C%2Ftd%3E+%3Ctd%3E+%3Ctable%3E+%3Ctbody%3E+%3Ctr%3E+%3Cth+class%3D%22underthick%22%3EA%3C%2Fth%3E+%3Cth+class%3D%22underthick%22%3EB%3C%2Fth%3E+%3C%2Ftr%3E+%3Ctr%3E+%3Cth+class%3D%22elements%22%3EData%3C%2Fth%3E+%3Cth+class%3D%22elements%22%3EDescription%3C%2Fth%3E+%3C%2Ftr%3E+%3Ctr%3E+%3Ctd%3E0.5%3C%2Ftd%3E+%3Ctd%3EProbability+associated+with+the+distribution%3C%2Ftd%3E+%3C%2Ftr%3E+%3Ctr%3E+%3Ctd%3E1%3C%2Ftd%3E+%3Ctd%3EValue+of+parameter+Min%3C%2Ftd%3E+%3C%2Ftr%3E+%3Ctr%3E+%3Ctd%3E3%3C%2Ftd%3E+%3Ctd%3EValue+of+parameter+Max%3C%2Ftd%3E+%3C%2Ftr%3E+%3Ctr%3E+%3Ctd%3E1.4%3C%2Ftd%3E+%3Ctd%3EValue+of+parameter+Mode%3C%2Ftd%3E+%3C%2Ftr%3E+%3Ctr%3E+%3Cth+class%3D%22elements%22%3EFormula%3C%2Fth%3E+%3Cth+class%3D%22elements%22%3EDescription+%28Result%29%3C%2Fth%3E+%3C%2Ftr%3E+%3Ctr%3E+%3Ctd%3E%3DNTTRIANGULARINV%28A2%2CA3%2CA4%2CA5%29%3C%2Ftd%3E+%3Ctd%3EInverse+of+the+cumulative+distribution+function+for+the+terms+above%3C%2Ftd%3E+%3C%2Ftr%3E+%3C%2Ftbody%3E+%3C%2Ftable%3E+%3C%2Ftd%3E+%3C%2Ftr%3E+%3C%2Ftbody%3E+%3C%2Ftable%3E+%3C%2Fli%3E+%3Cli%3EFunction+reference+%3A+%3Ca+href%3D%22%2Fnttriangularinv%2F%22%3ENTTRIANGULARINV%3C%2Fa%3E%3C%2Fli%3E+%3C%2Ful%3E+%3C%2Fdiv%3E+%3Ch2%3ECharacteristics%3C%2Fh2%3E+%3Ch3%3EMean%3Cspan+class%3D%22sub%22%3E+-+Where+is+the+%60%60center%27%27+of+the+distribution%3F+%28%3Ca+href%3D%22%2Fglossary%2F%23local_mean%22%3EDefinition%3C%2Fa%3E%29%3C%2Fspan%3E%3C%2Fh3%3E+%3Cdiv+class%3D%22detail%22%3E+%3Cul+class%3D%22dot%22%3E+%3Cli%3E%3Ca+href%3D%22%2Fglossary%2F%23local_mean%22%3EMean%3C%2Fa%3E+of+the+distribution+is+given+as+%3Cdiv+class%3D%22eq%22%3E%5Blatex%5D%5Cfrac%7Ba%2Bb%2Bc%7D%7B3%7D&bg=T&fg=000000&s=0 "F^{-1}(P)=\begin{cases}\sqrt{P(c-a)(b-a)}+a\quad&\left(P< \frac{c-a}{b-a}\right)\\-\sqrt{(1-P)(b-c)(b-a)}+b\quad&\left(P\geq \frac{c-a}{b-a}\right)\end{cases}[/latex]</div> </li> <li>How to compute this on Excel. <table class=\"table_example\"> <tbody> <tr> <td class=\"table_number\"> <table> <tbody> <tr> <th class=\"underthick\"> </th> </tr> <tr> <th>1</th> </tr> <tr> <th>2</th> </tr> <tr> <th>3</th> </tr> <tr> <th>4</th> </tr> <tr> <th>5</th> </tr> <tr> <th>6</th> </tr> <tr> <th>7 </th> </tr> </tbody> </table> </td> <td> <table> <tbody> <tr> <th class=\"underthick\">A</th> <th class=\"underthick\">B</th> </tr> <tr> <th class=\"elements\">Data</th> <th class=\"elements\">Description</th> </tr> <tr> <td>0.5</td> <td>Probability associated with the distribution</td> </tr> <tr> <td>1</td> <td>Value of parameter Min</td> </tr> <tr> <td>3</td> <td>Value of parameter Max</td> </tr> <tr> <td>1.4</td> <td>Value of parameter Mode</td> </tr> <tr> <th class=\"elements\">Formula</th> <th class=\"elements\">Description (Result)</th> </tr> <tr> <td>=NTTRIANGULARINV(A2,A3,A4,A5)</td> <td>Inverse of the cumulative distribution function for the terms above</td> </tr> </tbody> </table> </td> </tr> </tbody> </table> </li> <li>Function reference : <a href=\"/nttriangularinv/\">NTTRIANGULARINV</a></li> </ul> </div> <h2>Characteristics</h2> <h3>Mean<span class=\"sub\"> - Where is the ``center'' of the distribution? (<a href=\"/glossary/#local_mean\">Definition</a>)</span></h3> <div class=\"detail\"> <ul class=\"dot\"> <li><a href=\"/glossary/#local_mean\">Mean</a> of the distribution is given as <div class=\"eq\">[latex]\frac{a+b+c}{3}")
Standard Deviation – How wide does the distribution spread? (Definition)
- Variance of the distribution is given as
Standard Deviation is a positive square root of Variance.
- How to compute this on Excel
1 2 3 4 5 6
A B Data Description 1 Value of parameter Min 3 Value of parameter Max 1.4 Value of parameter Mode Formula Description (Result) =NTTRIANGULARSTDEV(A2,A3,A4) Standard deviation of the distribution for the terms above - Function reference : NTTRIANGULARSTDEV

Skewness – Which side is the distribution distorted into? (Definition)
- Skewness of the distribution is given as
- How to compute this on Excel
1 2 3 4 5 6
A B Data Description 1 Value of parameter Min 3 Value of parameter Max 1.4 Value of parameter Mode Formula Description (Result) =NTTRIANGULARSKEW(A2,A3,A4) Skewness of the distribution for the terms above - Function reference : NTTRIANGULARSKEW
(2a-b-c)(a-2b+c)}{5(a^2+b^2+c^2-ab-bc-ca)^{3/2}}")
Kurtosis – Sharp or Dull, consequently Fat Tail or Thin Tail (Definition)
- Kurtosis is
.
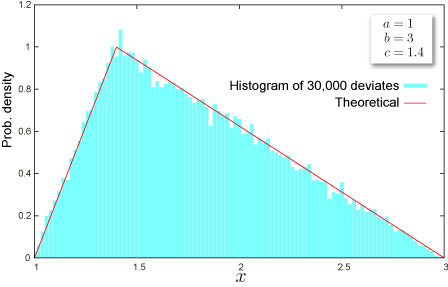
Random Numbers
- Random number x is generated by inverse function method, which is for uniform random U,
x=\begin{cases}\sqrt{U(c-a)(b-a)}+a\quad&\left(U< \frac{c-a}{b-a}\right)\\-\sqrt{(1-U)(b-c)(b-a)}+b\quad&\left(U\geq \frac{c-a}{b-a}\right)\end{cases}[/latex]
- How to generate random numbers on Excel.
1 2 3 4 5 6
A B Data Description 0 Value of parameter A 3 Value of parameter B 1.8 Value of parameter C Formula Description (Result) =NTRANDTRIANGULAR(100,A2,A3,A5,0) 100 triangular deviates based on Mersenne-Twister algorithm for which the parameters above Note The formula in the example must be entered as an array formula. After copying the example to a blank worksheet, select the range A6:A105 starting with the formula cell. Press F2, and then press CTRL+SHIFT+ENTER.
NtRand Functions
- If you already have parameters of the distribution
- Generating random numbers based on Mersenne Twister algorithm: NTRANDTRIANGULAR
- Computing probability : NTTRIANGULARDIST
- Computing quantile : NTTRIANGULARINV
- Computing mean : NTTRIANGULARMEAN
- Computing standard deviation : NTTRIANGULARSTDEV
- Computing skewness : NTTRIANGULARSKEW
- Computing kurtosis : NTTRIANGULARKURT
- Computing moments above at once : NTTRIANGULARMOM
- If you know mean, standard deviation and mode of the distribution
- Estimating parameters of the distribution:NTTRIANGULARPARAM
Reference
- Wolfram Mathworld – Triangular Distribution
- Wikipedia – Triangular distribution
- Statistics Online Computational Resource